
Gantt Charts
Planning and scheduling more complex projects
Gantt Charts (Gant Charts) are useful tools for analyzing and planning more complex projects. They:
- Help you to plan out the tasks that need to be completed
- Give you a basis for scheduling when these tasks will be carried out
- Allow you to plan the allocation of resources needed to complete the project, and
- Help you to work out the critical path for a project where you must complete it by a particular date.
Sequential and parallel activities:
An essential concept behind project planning (and Critical Path Analysis) is that some activities are dependent on other activities being completed first. As a shallow example, it is not a good idea to start building a bridge before you have designed it!These dependent activities need to be completed in a sequence, with each stage being more-or-less completed before the next activity can begin. We can call dependent activities 'sequential' or 'linear'.
Other activities are not dependent on completion of any other tasks. These may be done at any time before or after a particular stage is reached. These are nondependent or 'parallel' tasks.
Drawing a Gantt Chart
To draw up a Gantt diagram (Gant diagram), follow these steps:Step 1. List all activities in the plan
For each task, show the earliest start date, estimated length of time it will take, and whether it is parallel or sequential. If tasks are sequential, show which stages they depend on.You will end up with a task list like the one in figure 1. This example shows the task list for a custom-written computer project. We will use this same example for both this section and the section on Critical Path Analysis and PERT. This will allow you to compare the results of the two approaches.
Figure 1. Gantt Chart Example: Planning a custom-written computer project
| Task | Earliest start | Length | Type | Dependent on... |
|---|---|---|---|---|
| A. High level analysis | Week 0 | 1 week | Sequential | |
| B. Selection of hardware platform | Week 1 | 1 day | Sequential | A |
| C. Installation and commissioning of hardware | Week 1.2 | 2 weeks | Parallel | B |
| D. Detailed analysis of core modules | Week 1 | 2 weeks | Sequential | A |
E. Detailed analysis of supporting modules | Week 3 | 2 weeks | Sequential | D |
F. Programming of core modules | Week 3 | 2 weeks | Sequential | D |
G. Programming of supporting modules | Week 5 | 3 weeks | Sequential | E |
H. Quality assurance of core modules | Week 5 | 1 week | Sequential | F |
I. Quality assurance of supporting modules | Week 8 | 1 week | Sequential | G |
J. Core module training | Week 6 | 1 day | Parallel | C,H |
K. Development and QA of accounting reporting | Week 5 | 1 week | Parallel | E |
L. Development and QA of management reporting | Week 5 | 1 week | Parallel | E |
M. Development of Management Information System | Week 6 | 1 week | Sequential | L |
N. Detailed training | Week 9 | 1 week | Sequential | I, J, K, M |
Step 2. Set up your Gantt Chart
Head up graph paper with the days or weeks through to task completion.Step 3. Plot the tasks onto the graph paper
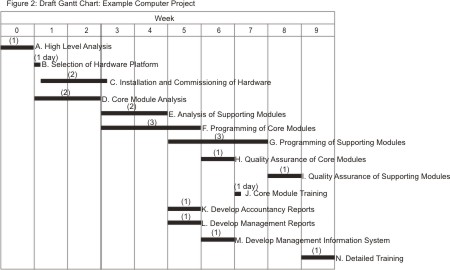
Next draw up a rough draft of the Gantt Chart. Plot each task on the graph paper, showing it starting on the earliest possible date. Draw it as a bar, with the length of the bar being the length of the task. Above the task bars, mark the time taken to complete them.Schedule them in such a way that sequential actions are carried out in the required sequence. Ensure that dependent activities do not start until the activities they depend on have been completed.
This will produce an untidy diagram like the one below:
Step 4. Presenting the analysis
The last stage in this process is to prepare a final version of the Gantt Chart. This shows how the sets of sequential activities link together, and identifies the critical path aftivities. At this stage you also need to check the resourcing of the various activities. While scheduling, ensure that you make best use of the resources you have available, and do not over-commit resource.You can also use color to represent the different resource types that you need to use such as programmers, or analysts.
A redrawn version of the example project is shown below:
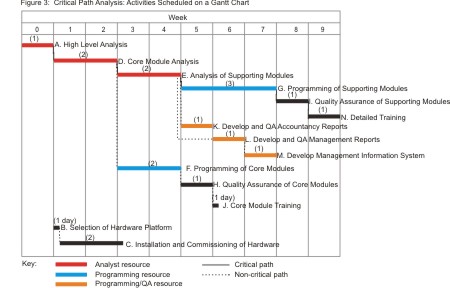
- If all goes well, the project can be completed in 10 weeks.
- If you want to complete the task as rapidly as possible, you need:
- 1 analyst for the first 5 weeks.
- 1 programmer for 5 weeks starting week 4.
- 1 programmer/QA expert for 3 weeks starting week 6. Note: Activities L and M have been moved back a week. This does not affect the critical path, but it does mean that a single programming/QA resource can carry out all three of activities K, L and M.
- Analysis, development and testing of supporting modules are essential activities that must be completed on time.
- Hardware installation and commissioning is not time-critical as long as it is completed before the Core Module Training starts.
Key Points:
Gantt charts are useful tools for planning and scheduling projects. They allow you to assess how long a project should take, determine the resources needed, and lay out the order in which tasks need to be carried out. They are useful in managing the dependencies between tasks.When a project is under way, Gantt charts are useful for monitoring its progress. You can immediately see what should have been achieved at a point in time, and can therefore take remedial action to bring the project back on course. This can be essential for the successful and profitable implementation of the project.
2 comentários:
Parabéns pelo excelente roteiro,
Suely Grosseman
Oi, Suely! Obrigado por prestigiar o nosso blog! Seus comentários são sempre benvindos!
Postar um comentário